Quality is visible—in the process, not just in the final product.
The Quality Cockpit combines process and quality data into a single view. Cpk, SPC, correlations, and Pareto charts are displayed right next to component traceability—quality engineers and plant management can see connections and root causes rather than just symptoms, and can take preventive action instead of merely reacting. You can independently link existing inspection and quality data to the platform’s process data—as a configuration, not as a project.

A batch with an anomaly. A question back to the process.
The Cpk value for a batch falls below the threshold. During the same time period, the machine temperature was above the usual average for two shifts—the correlation plot illustrates this relationship. Check the tool cooling, readjust the SPC limits in process control, and document the incident in the shift log. Instead of a hypothesis, this provides a clear starting point—next time, the platform will intervene sooner.
When Process and Quality Are Visible Together
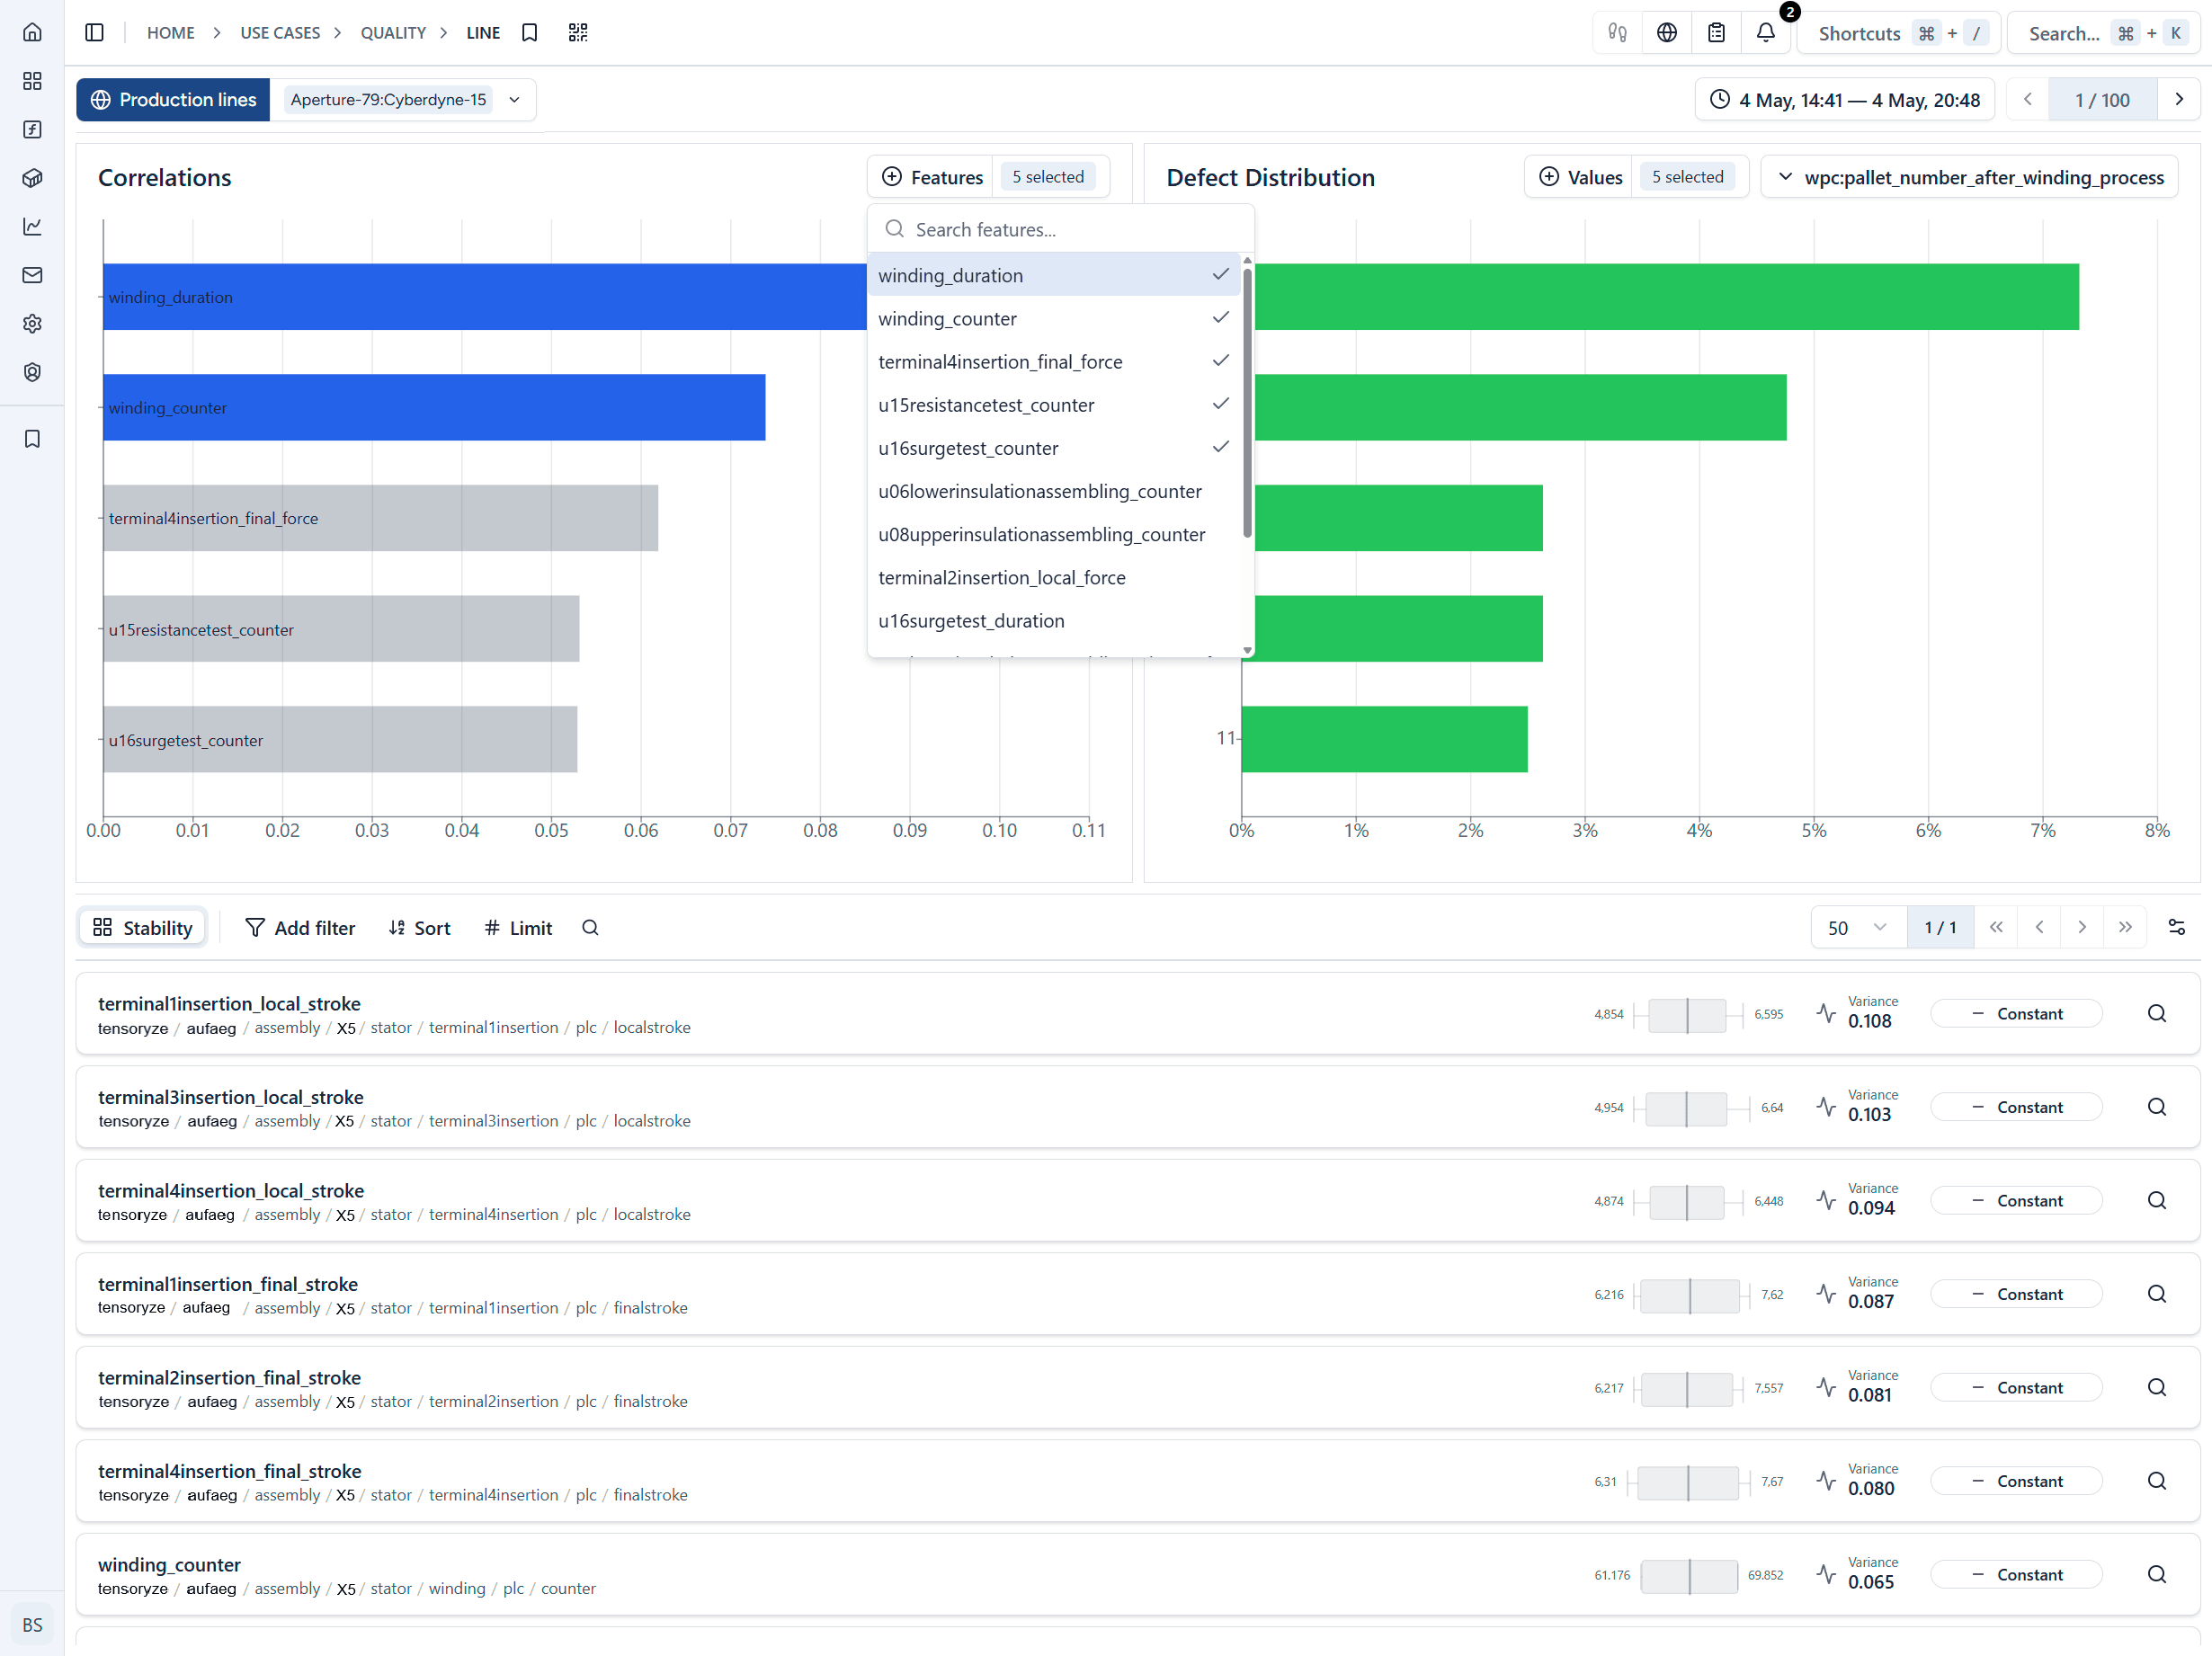
Find the causes, not just the symptoms
Correlations between process parameters and quality results become apparent without anyone having to compare data across systems—fewer hypotheses, more reliable actions.
Take preventive action
Recognized patterns become new rules in process control. What was once detected too late is detected early enough the next time—resulting in less scrap and fewer complaints.
Audit Documentation at the Push of a Button
Quality reports for internal reviews or external audits are generated by the system. Incident, cause, action, approval status—all can be exported as reports without the need for subsequent reconstruction.
Quality and process data in a shared database.
Inspection data from measuring equipment, lab reports, and inline inspection is linked to process and machine data in the unified namespace. The Cockpit aggregates data across lines, shifts, products, and locations—Cpk and SPC charts, correlations, and Pareto analyses, as well as component traceability, are just one click away, just like the individual component.
- Process Capability and SPC: Cpk and Cp per variant, SPC limits based on the stored SOPs (LSL/USL), in-spec rate, and out-of-tolerance counts in real time.
- Correlations, Pareto, and Drift:Which Parameters Drive Quality Problems — Significant Correlations, Pareto Analysis of Defect Drivers, and Autocorrelation for Gradual Shifts.
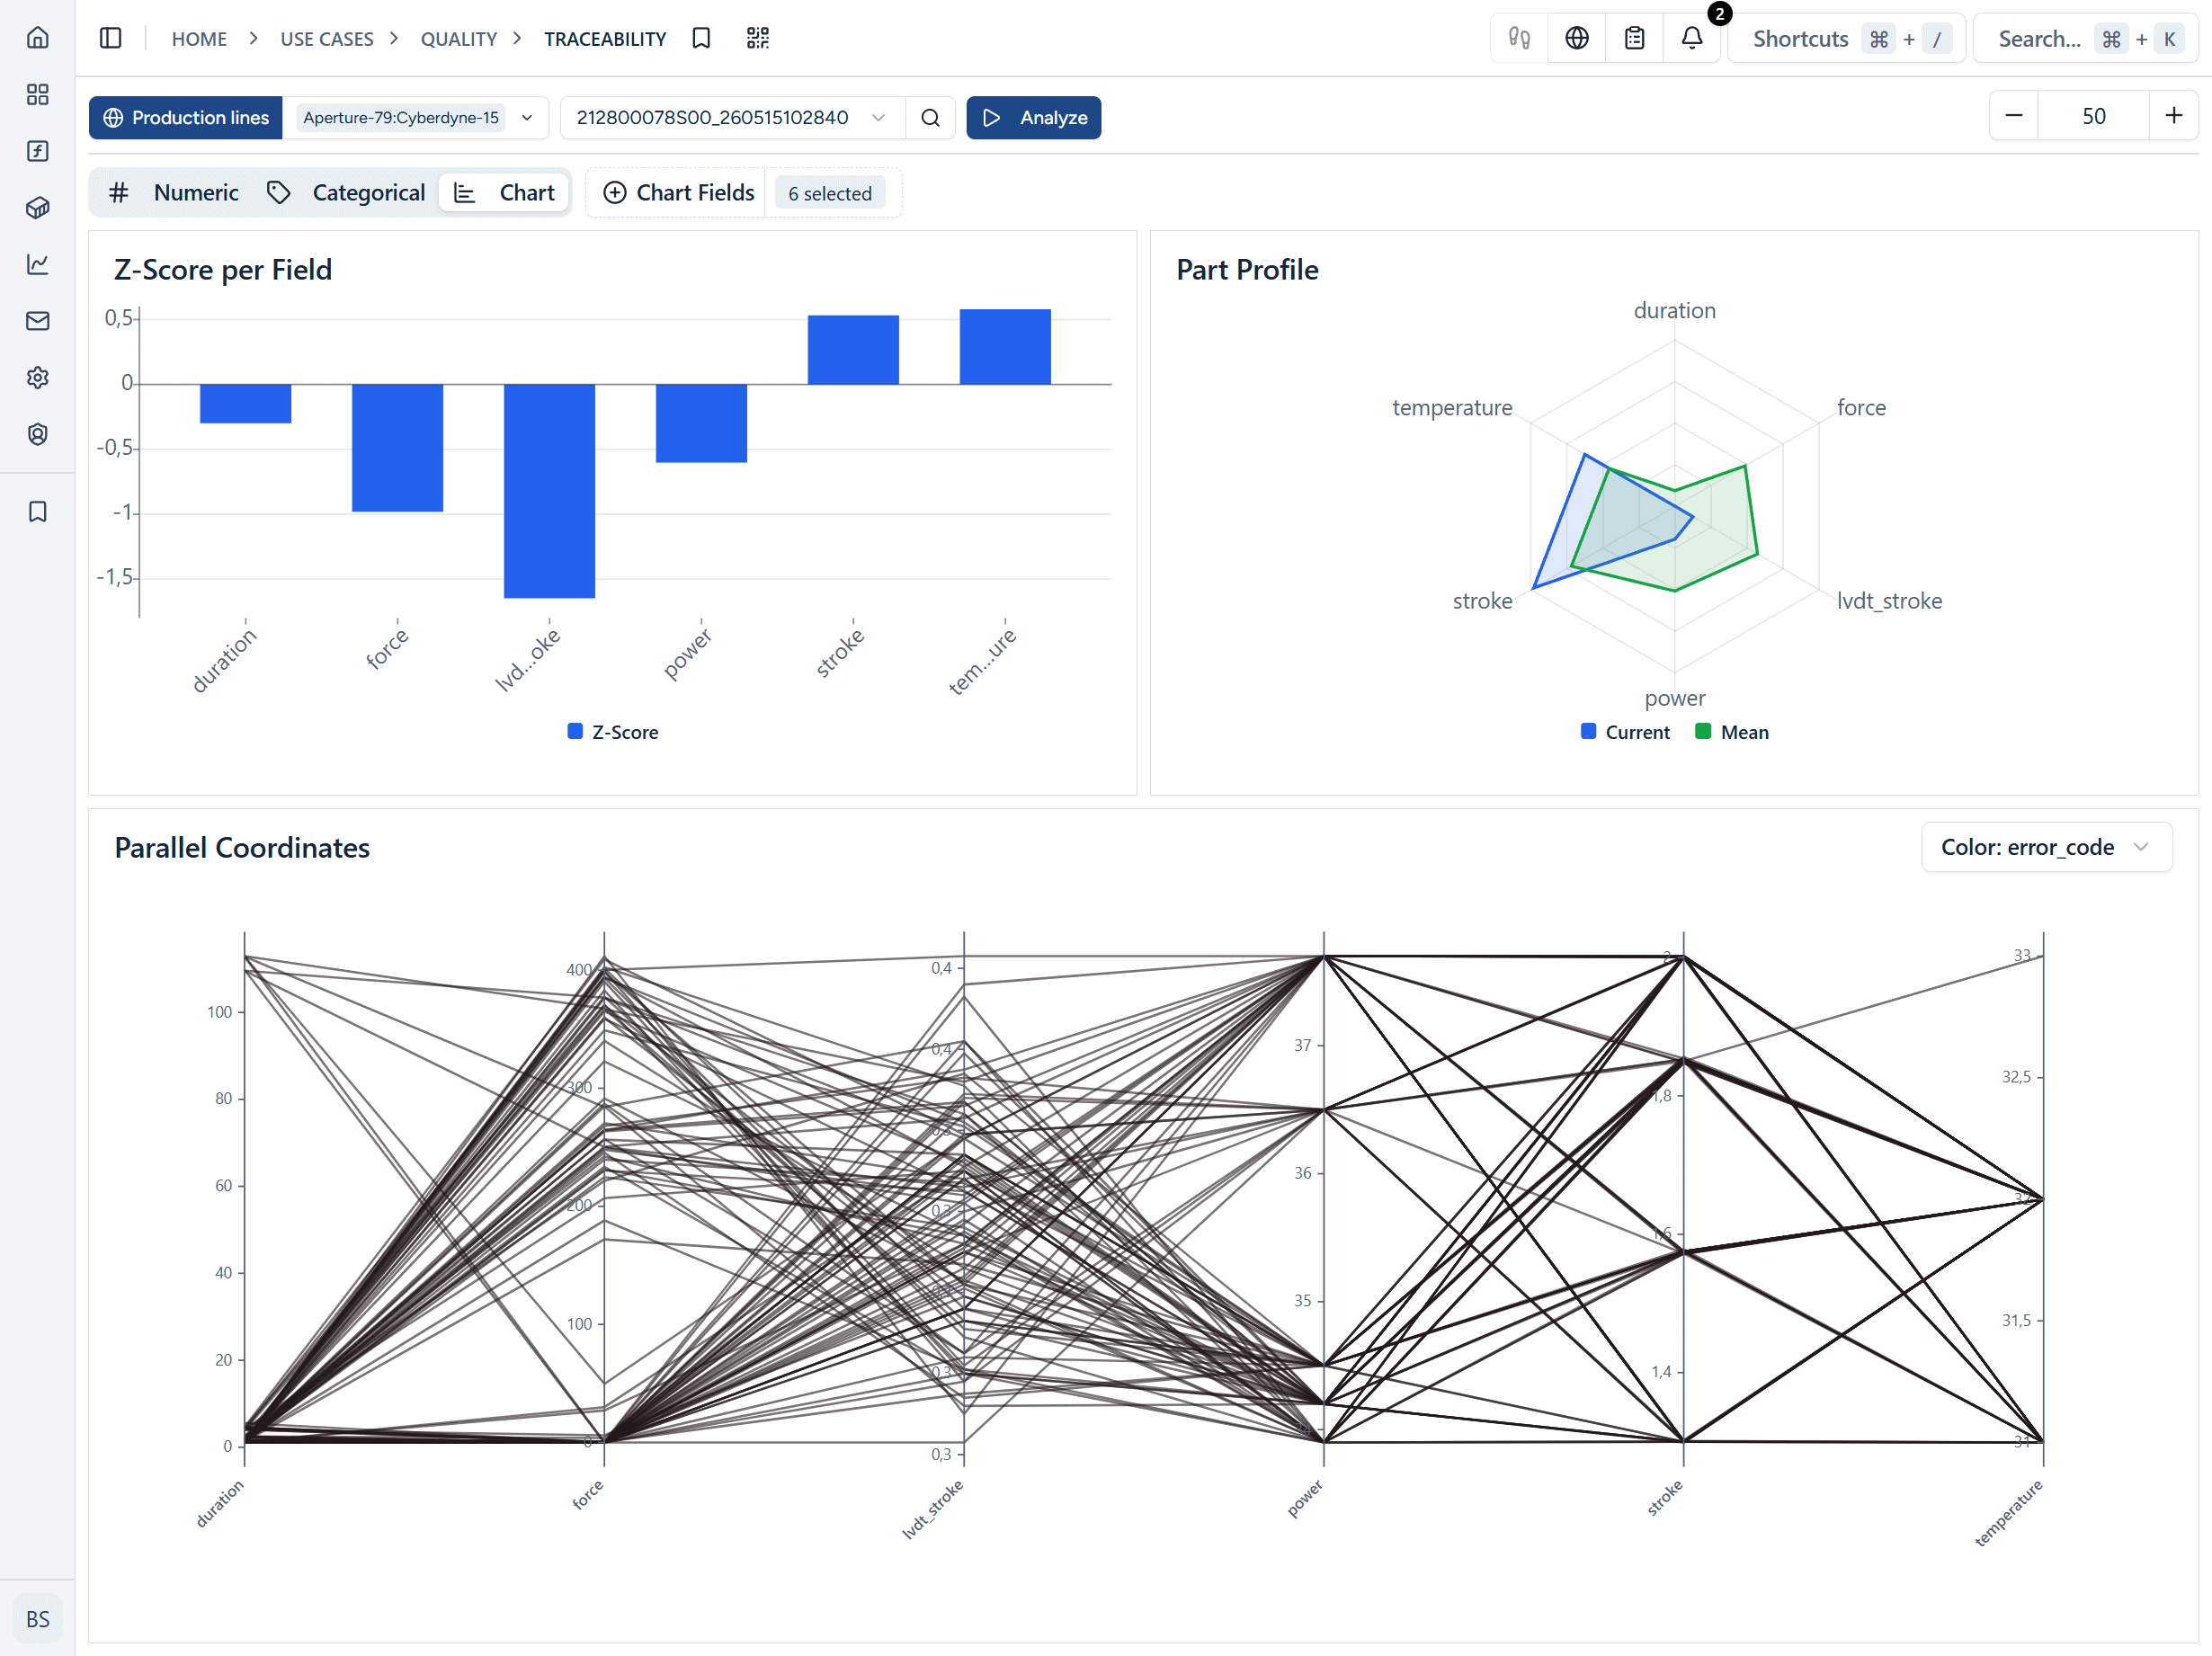
- Traceability and Component Comparison:Every part is traceable down to the individual unit—including comparisons with other parts from the same batch, shift, or product variant (Z-score outliers); Structured approvals for process, quality, safety, maintenance, and change requests—with an audit trail and expiration date.
Mobile
On the tablet in the gym. On the phone during the break.
The key features—line status, alarms, shift log, and live stream—can be accessed just as easily on mobile devices as on a desktop. The user interfaces are designed for use while wearing gloves, on the go, and in noisy environments: large touch areas, clear contrasts, and short navigation paths.
- Notifications for Alarms and Tickets
- Voice input for hands-free situations
- Offline tolerance for unstable Wi-Fi areas in the hall


Solutions
More Solutions at a Glance
Your data. A common foundation.
Let's work together to determine how your machines, systems, and data sources can be integrated into a robust platform architecture.