How is production going—now, yesterday, and across different locations?
Live dashboards for the shop floor and management, all based on the same data source. Error messages, output, OEE, downtime analyses, line and site comparisons—every role gets the view it needs. Operators, shift supervisors, plant management, and executive management all work with the same data, without anyone having to compile Excel reports. Your managers can create and modify layouts and key metric definitions themselves—without having to wait for outside help.
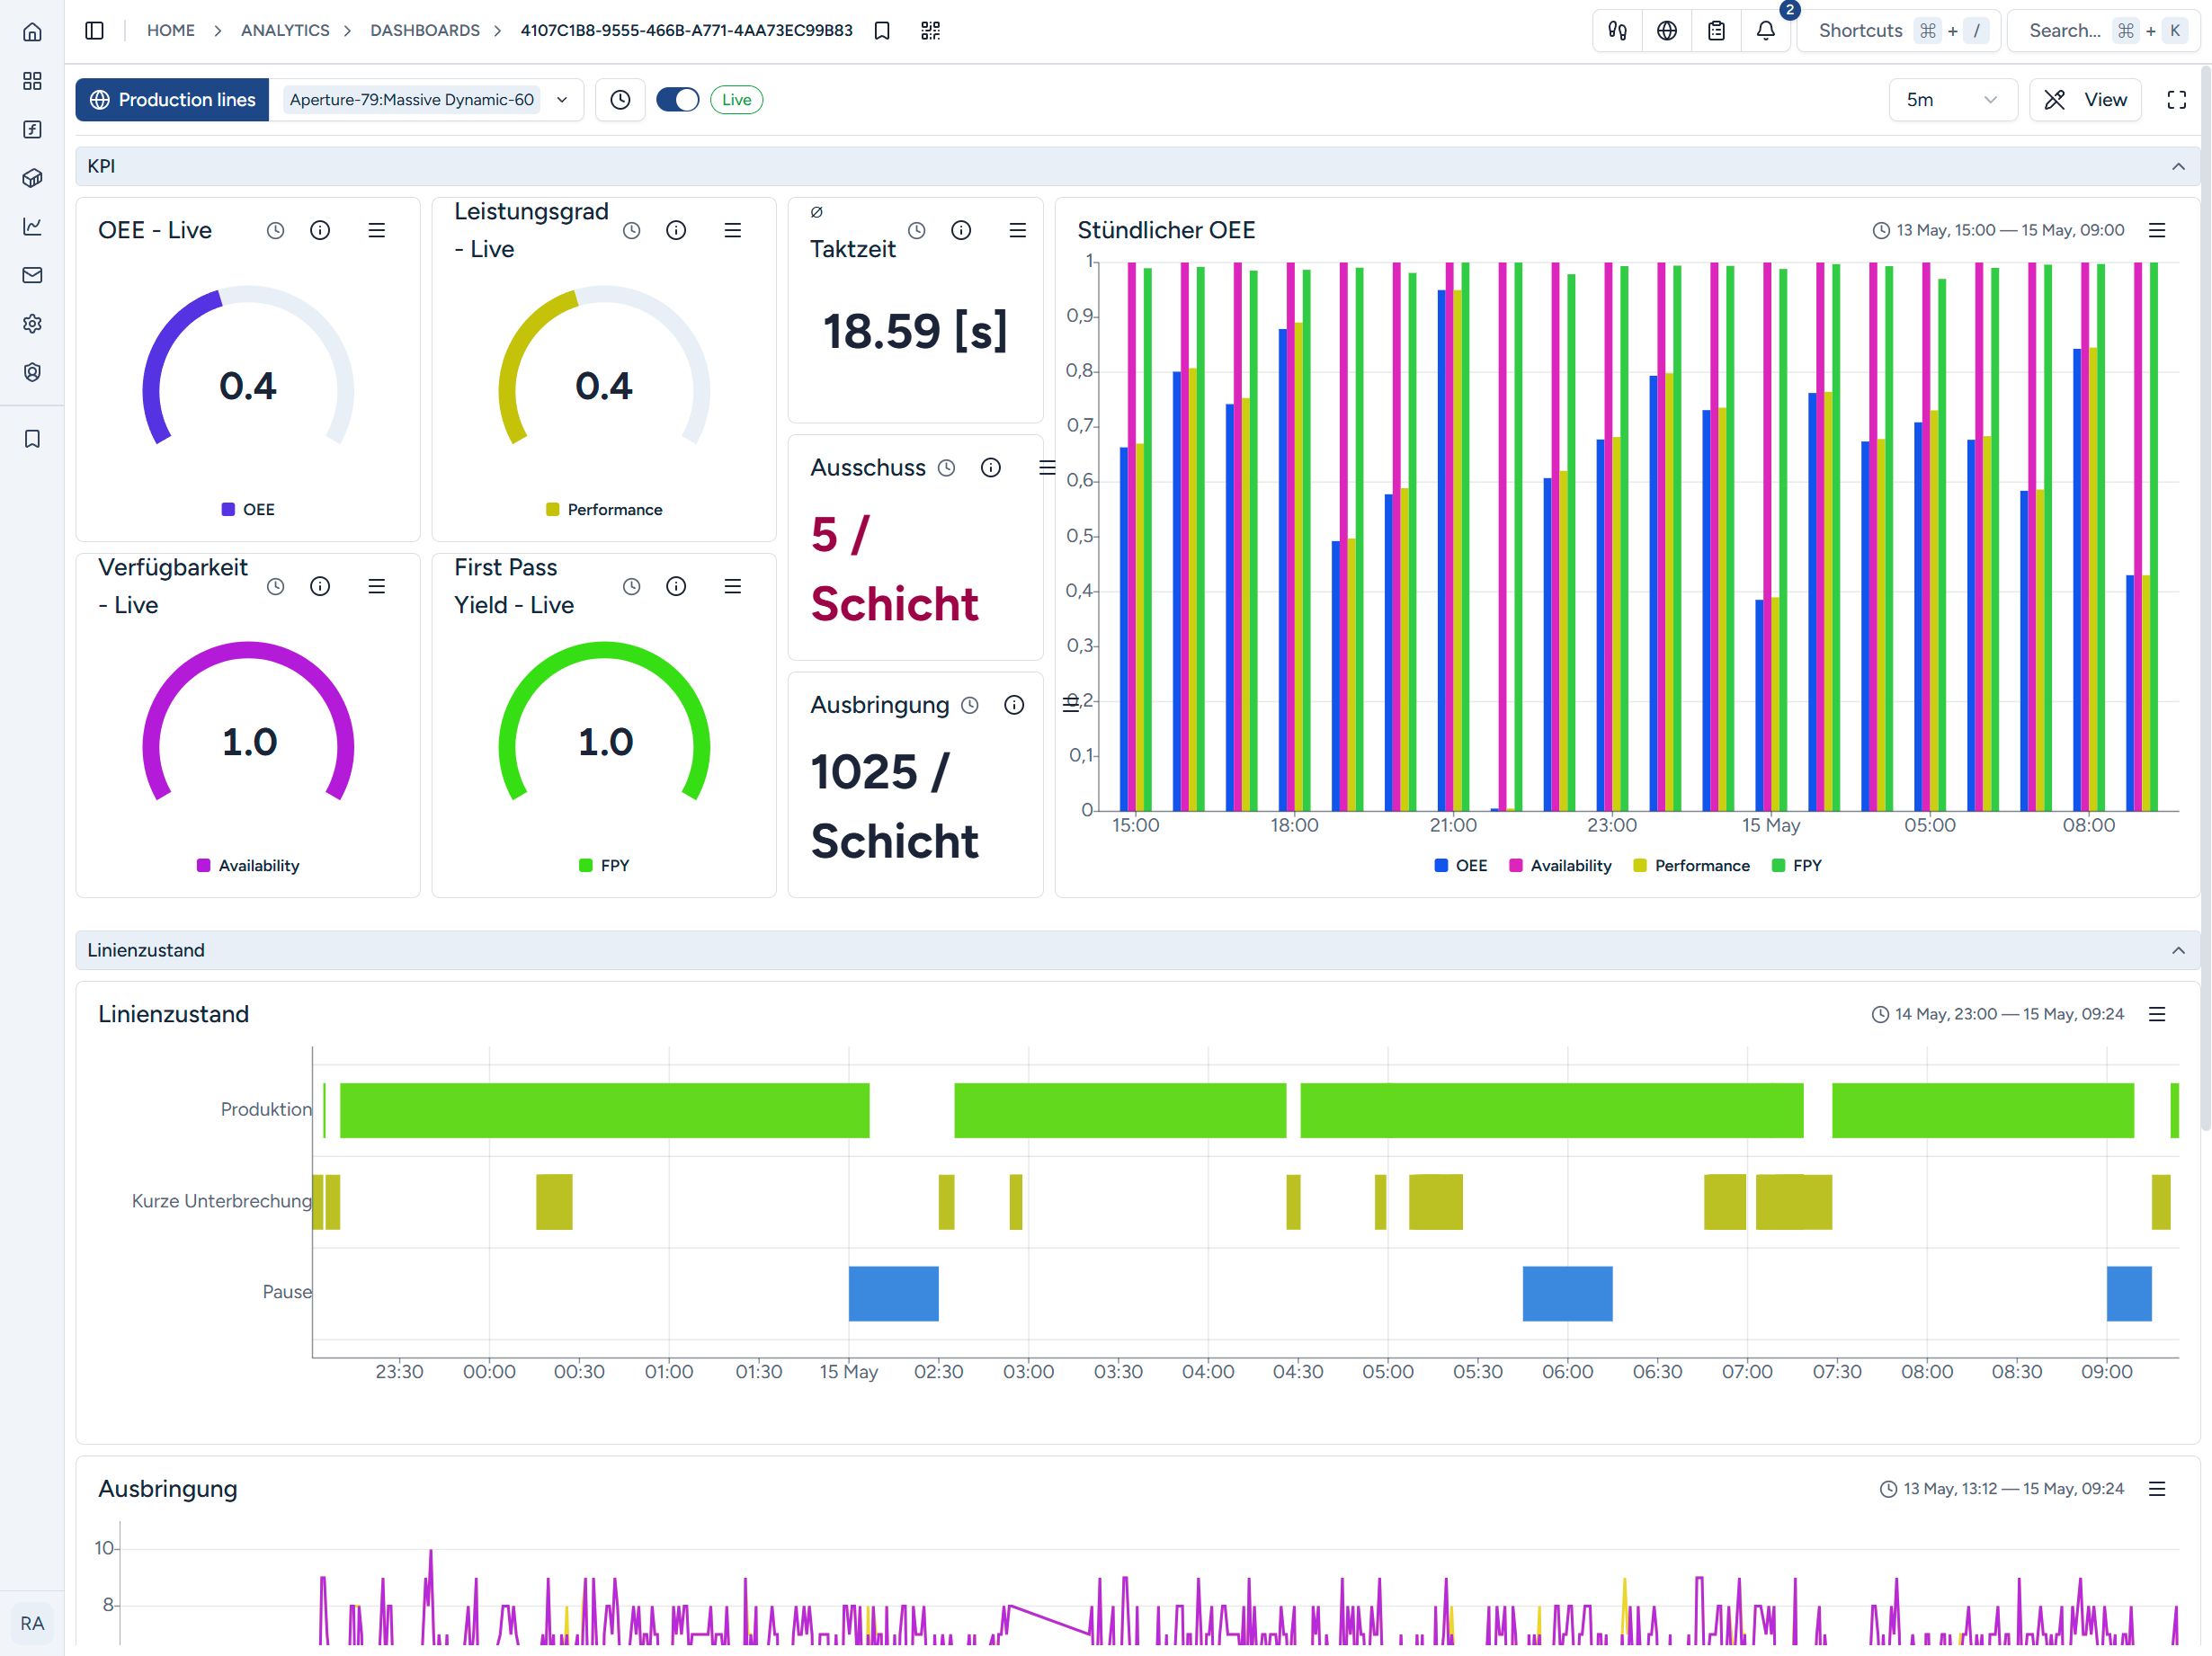

A scene
Line 4 is behind schedule. One question, three clicks to the cause.
Plant B is four percent below target in the site comparison. Clicking on the affected line reveals that there is no major disruption, just minor stoppages during tool changes. A second click pinpoints the problem to a specific shift and a specific changeover step. In just three clicks, you go from the site comparison to the root cause—a concrete starting point for the next shift handoff.
Effect
When all the dice show the same numbers.
A view for all roles
Operators, shift supervisors, plant management, and executive management all work from the same data source, with role-specific levels of detail—no more duplicate reports, no more discussions about the data source, and no more Excel processing.
Faster Decisions
Real-time data instead of a report from the previous day. Trends, downtime patterns, and line status are visible the moment they occur—response times measured in hours rather than waiting for the next daily report.
Comparability
Line by line, shift by shift, location by location—based on identically calculated metrics. Best-practice transfer becomes measurable rather than anecdotal.


How It Works
Key metrics that, once defined, are consistent across the board.
Key performance indicators are defined centrally—OEE, availability, performance, quality—and are calculated identically across all dashboards. Layouts are customized by role and by plant without altering the calculation logic. The specific meaning of a key performance indicator at your plant is determined in collaboration with your plant managers and shift supervisors and saved as a platform template.
- Automatic OEE calculation based on integrated machine data—consistent across all lines, with traceable definitions for availability, performance, and quality.
- Configurable dashboards by role:operator tablet, shift supervisor terminal, plant management view, and site comparison—same data, different presentation.
- Drill-down from the KPI to the machine:From the site, through the plant and production line, down to the individual downtime event—one click per level, without switching applications.
Mobile
Live status on the tablet—whether in the office or on a site tour.
Live dashboards, OEE, and site comparisons can be accessed just as easily on a tablet or phone as they can at a desk. Plant management can check the status while on the go, and shift supervisors can access drill-down reports during their rounds—the same figures, formatted for mobile devices, without the need for a separate report.
- Role-specific dashboards for tablets and phones—same data source as on the desktop
- Drill down from the site through the plant and production line to the shutdown—even on the go
- Push notification when a line falls below plan


Solutions
More Solutions at a Glance
Your data. A common foundation.
Let's work together to determine how your machines, systems, and data sources can be integrated into a robust platform architecture.